| |
Michael Hill International operates Michael Hill Jeweller - an Australasian retail jewellery chain with 115 stores between Australia and New Zealand as at 31 June 2001. The Company began in 1979 when Michael Hill opened the first store in the New Zealand town of Whangarei, some 160 kilometres north of Auckland.
A unique retail jewellery formula that included dramatically different store designs, a product range devoted exclusively to jewellery and almost saturation levels of high impact advertising elevated the Company to national prominence and record sales.
The Company grew rapidly, expanding to 10 stores by 1987 - the same year it was listed on the New Zealand Stock Exchange. 1987 also saw expansion into Australia, opening the first store in August, in the Brisbane suburb of Indooroopilly.
Today the Group employs over 1200 full and part time employees in retailing, manufacturing and administration. It has approximately 2200 shareholders and is the most profitable publicly listed retail jeweller in Australia/New Zealand.
Our Corporate Objectives:
- To provide a superior long term return for our shareholders.
- To provide employees with secure rewarding long term employment in an environment where excellence is encouraged.
Our Vision:
- To strive for perfection in jewellery retailing and manufacturing, and provide the highest quality, service and value to our customers.
| |
2001
|
2000
|
|
Trading Results
|
|
|
|
|
181,168
|
181,983
|
- Group surplus after tax ($000's)
|
10,03
|
9,939
|
|
|
7,745
|
7,494
|
|
|
2,294
|
2,445
|
| |
|
|
|
Financial Position
|
|
|
|
|
91,331
|
82,394
|
- Total shareholders' funds ($000's)
|
49,568
|
42,587
|
| |
|
|
|
Ratios
|
|
|
- Group surplus after tax to average
|
|
|
|
|
11.6%
|
12.7%
|
|
|
21.8%
|
24.9%
|
|
|
26.0¢
|
25.8¢
|
|
|
54%
|
52%
|
|
|
8.1
|
10.6
|
|
|
5.1:1
|
3.5:1
|
| |
|
|
|
Number of stores 30 June
|
|
|
|
|
41
|
40
|
|
|
74
|
66
|
| Total |
115
|
106
|
| |
|
|
|
Distribution to shareholders
|
|
|
- Dividends - including final dividend
|
|
|
|
|
15.0¢
|
13.5¢
|
- Times covered by surplus after tax
|
1.73
|
1.90
|
| |
|
|
|
Issued and paid up capital
|
|
|
- 38,558,600 Ordinary shares ($000's)
|
7,712
|
7,712
|
| |
|
|
|
Share price - 30 June
|
$3.80
|
$2.85
|
|
|
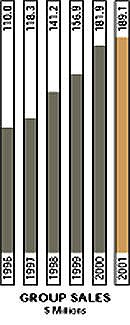
- Group revenue up 4% to $189 million.
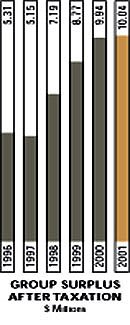
- Group surplus after tax increased to $10,039,000.
- Dividend up 11% for the year.
- Nine new stores opened during the year.
- An excellent 22% return on shareholders' funds.
- Same store sales up 2.9% in New Zealand and 3.5% in Australia (GST adjusted) .
|
TREND STATEMENT
|
|
2001
|
2000
|
1999
|
1998
|
1997
|
1996
|
|
$000
|
$000
|
$000
|
$000
|
$000
|
$000
|
| Group sales |
$189,168
|
$181,983
|
$156,940
|
$141,254
|
$118,303
|
$110,060
|
|
|
| Earnings |
|
|
|
|
|
|
| Surplus before taxation |
15,130
|
15,517
|
13,549
|
11,059
|
8,037
|
8,181
|
| Tax provision |
5,091
|
5,578
|
4,775
|
3,867
|
2,883
|
2,865
|
| Surplus after tax |
10,039
|
9,939
|
8,774
|
7,192
|
5,154
|
5,316
|
| Dividend distributions |
2,518*
|
5,216
|
4,444
|
3,669
|
2,695
|
2,513
|
| Retained surplus for year |
7,521
|
4,723
|
4,330
|
3,523
|
2,459
|
2,803
|
| Funds employed |
|
|
|
|
|
|
| Paid-up ordinary capital |
7,712
|
7,712
|
7,712
|
7,712
|
7,712
|
7,712
|
| Reserves and retained earnings |
41,856
|
34,875
|
29,339
|
24,605
|
20,310
|
18,396
|
| Shareholders funds |
49,568
|
42,587
|
37,051
|
32,317
|
28,022
|
26,108
|
| Long term debt / deferred tax |
28,503
|
22,670
|
21,849
|
18,302
|
18,904
|
18,001
|
|
$ 78,071
|
$ 65,257
|
$ 58,900
|
$ 50,619
|
$ 46,926
|
$ 44,109
|
| Utilisation of funds |
|
|
|
|
|
|
| Non current assets |
22,652
|
19,635
|
14,583
|
13,169
|
13,106
|
13,621
|
| Expenditure carried forward / goodwill |
505
|
625
|
756
|
892
|
974
|
1,146
|
| Net working capital |
54,914
|
44,997
|
43,561
|
36,558
|
32,846
|
29,342
|
|
$ 78,071
|
$ 65,257
|
$ 58,900
|
$ 50,619
|
$ 46,926
|
$ 44,109
|
| |
| *Note change in accounting policy detailed in the notes to the Financial Statements. |
|
| |
| CASH FLOW STATEMENT |
2001
|
2000
|
1999
|
1998
|
1997
|
1996
|
|
$000
|
$000
|
$000
|
$000
|
$000
|
$000
|
| Net profit before tax |
15,130
|
15,517
|
13,549
|
11,059
|
8,037
|
8,181
|
| Depreciation |
4,280
|
4,264
|
2,903
|
2,783
|
2,398
|
2,003
|
| Other non-cash adjustments |
147
|
1,545
|
1,002
|
1,901
|
(183)
|
1,372
|
| Tax paid |
(7,911)
|
(5,718)
|
(4,567)
|
(3,786)
|
(3,179)
|
(2,303)
|
| Dividends |
(5,410)
|
(4,638)
|
(4,059)
|
(3,091)
|
(2,695)
|
(2,012)
|
| Working capital increase |
(3,759)
|
(1,394)
|
(10,106)
|
(3,455)
|
(4,028)
|
(2,175)
|
| Capital expenditure |
(8,028)
|
(9,161)
|
(4,502)
|
(2,652)
|
(2,751)
|
(3,750)
|
| Other |
0
|
0
|
(30)
|
(82)
|
(20)
|
(21)
|
| Surplus cash pre external funds |
($ 5,551)
|
$ 415
|
($ 5,810)
|
$ 2,677
|
($ 2,421)
|
$ 1,295
|
| External source of funds |
|
|
|
|
|
|
| Net borrowings/(repayments) |
6,250
|
0
|
3,455
|
(1,750)
|
1,152
|
(1,631)
|
| Asset sales |
178
|
146
|
222
|
238
|
101
|
241
|
| Surplus cashflow |
$ 877
|
$ 561
|
($ 2,133)
|
$ 1,165
|
($ 1,168)
|
($ 95)
|
|
|
| STATISTICS |
|
|
|
|
|
|
|
2001
|
2000
|
1999
|
1998
|
1997
|
1996
|
| Earnings per share |
26.03¢
|
25.8¢
|
22.8¢
|
18.7¢
|
13.4¢
|
13.8¢
|
| Net tangible asset backing |
$1.27
|
$1.09
|
94.6¢
|
82.1¢
|
71¢
|
66¢
|
| Interest cover (times) |
8.1
|
10.6
|
9.9
|
8.0
|
6.1
|
6.0
|
| Net debt $000s |
$27,113
|
$22,051
|
$21,234
|
$16,023
|
$17,710
|
$15,890
|
| Dividend per ordinary share |
15.0¢
|
13.5¢
|
11.5¢
|
9.5¢
|
7.0¢
|
6.5¢
|
| % of tax paid profit paid as dividend |
25.0%
|
52.3%
|
50.5%
|
51.0%
|
52.3%
|
47.1%
|
| Working capital ratio |
5.1:1
|
3.6:1
|
3.8:1
|
3.9:1
|
4.3:1
|
3.8:1
|
| EBIT/Sales % |
9.1%
|
9.4%
|
9.6%
|
8.9%
|
8.1%
|
8.9%
|
| Return on average capital funds |
21.8%
|
24.9%
|
25.3%
|
24%
|
19%
|
22%
|
| Jewellery stores at year end |
115
|
106
|
102
|
94
|
88
|
82
|
| Exchange rate for translating Australian results |
.79
|
.80
|
.84
|
.83
|
.91
|
.87
|
|
|
| Note change in accounting policy relating to providing for final dividend. |
|
|
|
|